

Github 網址:https://github.com/matplotlib/mplfinance
mplfinance 是專門用於金融數據的可視化分析的 Python 模組,作者 Daniel Goldfarb 於 2019 年 11 月接管了長期無人維護的 matplotlib/mpl-finance ,由於原模組最近一次更新時間已經是四年前 ( 2016 年 ) 了,作者決定棄用該模組並改良開發出新的 matplotlib/mplfinance,目前調用原模組已經出現下列警告了 。
=================================================================

 WARNING: `mpl_finance` is deprecated:

 Please use `mplfinance` instead (no hyphen, no underscore).

 To install: `pip install --upgrade mplfinance`

For more information, see: https://pypi.org/project/mplfinance/

=================================================================
新的 mplfinance 與 mpl_finance 功能相近但使用區別還是蠻大的,之前的 candlestick2_ochl () 方法已經被棄用了,取代之的是 plot 和 make_addplot,這兩個方法的調用方法也完全不一樣,新的 plot 可以直接使用 pandas 數據格式 ( 舊的 mpl_finanace 只支持 numpy 數據 ),而且新的 plot 可以自動將圖表打印出來,繪製均線只需要一個關鍵字,自動剔除停盤時間段的空白,還有時間坐標都是自動完成的,比起原模組人性化許多,非常方便。
由於 mplfinance 需要 matplotlib 及 pandas 模組,如果未安裝請輸入:
pip install pandas
pip install matplotlib
如果環境中已經有 matplotlib ,調用 mpl_finance 應該會看到上述提醒,請輸入:
pip install --upgrade mplfinanceimport time
import requests
import numpy as np
import pandas as pd
import mplfinance as mpf
import matplotlib.pyplot as plt
from talib import abstract
from datetime import datetime這裡特別強調一下,mplfinance 輸入的數據必須是 pandas.DataFrame 類型,對數據格式也有要求,必須含有 ‘Open’ , ‘High’ , ‘Low’ , ‘Close’ , ‘Volume’,列索引為pandas.DatetimeIndex 格式、名稱為 ‘Date’。
# # DataFrame Setting
pd.set_option('display.max_columns', None)
pd.set_option('display.max_rows', None)
pd.set_option('max_colwidth',100)
pd.set_option('display.width', 5000)
pd.set_option('display.unicode.ambiguous_as_wide', True)
pd.set_option('display.unicode.east_asian_width', True)

# # Global Variables Setting
symbol = 'BTCUSDT'
url = 'https://api.binance.com/'

# # Get Market Data
def GetKline(url, symbol, interval, startTime = None, endTime = None):
    try:
        data = requests.get(url + 'api/v3/klines', params={'symbol': symbol, 'interval': interval, 'startTime': startTime, 'limit': 1000}).json()
    except Exception as e:
        print ('Error! problem is {}'.format(e.args[0]))
    tmp  = []
    pair = []
    for base in data:
        tmp  = []
        for i in range(0,6):
            if i == 0:
                base[i] = datetime.fromtimestamp(base[i]/1000)
            tmp.append(base[i])
        pair.append(tmp)
    df = pd.DataFrame(pair, columns=['date', 'open', 'high', 'low', 'close', 'volume'])
    df.date = pd.to_datetime(df.date)
    df.set_index("date", inplace=True)
    df = df.astype(float)
    return df

def GetHistoricalKline(url, symbol, interval, startTime):
    # init
    klines = GetKline(url, symbol, interval)
    tmptime = ToMs(klines.iloc[0].name)

    # Send request until tmptime > startTime
    while tmptime > startTime:
        tmptime -= PeriodToMs(interval) * 1000 # tmp minus period ms plus 1000 (1000 K)
        if tmptime < startTime:
            tmptime = startTime
        tmpdata = GetKline(url, symbol, interval, tmptime)
        klines  = pd.concat([tmpdata, klines])

    return klines.drop_duplicates(keep='first', inplace=False)

# Math Tools
def ToMs(date):
    return int(time.mktime(time.strptime(str(date), "%Y-%m-%d %H:%M:%S")) * 1000) # Binance timestamp format is 13 digits

def PeriodToMs(period):
    Ms = None
    ToSeconds = {
        "m": 60,
        "h": 60 * 60,
        "d": 24 * 60 * 60,
        "w": 7 * 24 * 60 * 60
    }
    unit = period[-1]

    if unit in ToSeconds:
        try:
            Ms = int(period[:-1]) * ToSeconds[unit] * 1000
        except ValueError:
            pass
return Ms程式:
if __name__ == "__main__":
    klines = GetHistoricalKline(url, symbol, '4h', ToMs('2019-05-01 12:00:00'))
    print (klines)
輸出:
                         open      high       low     close         volume
date
2019-05-01 12:00:00   5348.92   5357.00   5337.62   5353.40    1700.049906
2019-05-01 16:00:00   5352.60   5366.90   5326.05   5362.14    2492.910405
2019-05-01 20:00:00   5363.42   5364.00   5333.00   5355.35    2687.890665
2019-05-02 00:00:00   5355.34   5402.00   5342.75   5367.41    4460.837124
2019-05-02 04:00:00   5365.98   5393.54   5355.00   5383.20    1441.683741
2019-05-02 08:00:00   5383.20   5394.00   5373.20   5387.54    1653.188115
2019-05-02 12:00:00   5387.51   5415.00   5370.00   5406.31    2434.210000
2019-05-02 16:00:00   5408.04   5460.00   5405.30   5446.38    4679.065894
2019-05-02 20:00:00   5444.72   5535.60   5418.10   5523.99    6505.034923
2019-05-03 00:00:00   5523.99   5538.00   5472.28   5506.98    4350.239886
2019-05-03 04:00:00   5506.01   5520.00   5484.01   5492.87    3174.049017
2019-05-03 08:00:00   5494.81   5600.00   5477.57   5579.46    6915.079719
2019-05-03 12:00:00   5579.00   5700.00   5566.00   5695.09    7810.239494
2019-05-03 16:00:00   5695.66   5844.00   5653.74   5750.99   16733.253891
2019-05-03 20:00:00   5750.07   5843.00   5749.32   5787.00    6968.440655
2019-05-04 00:00:00   5786.31   5807.00   5725.00   5757.84    4783.590050
2019-05-04 04:00:00   5758.53   5801.25   5742.00   5772.69    3086.569040
2019-05-04 08:00:00   5770.62   5900.00   5768.73   5844.18    7598.047591
2019-05-04 12:00:00   5841.50   5844.34   5755.48   5814.01    6310.929872
2019-05-04 16:00:00   5815.54   5820.00   5756.00   5789.55    3869.435794
2019-05-04 20:00:00   5789.55   5795.99   5587.45   5641.19   10099.720711
2019-05-05 00:00:00   5641.73   5694.30   5624.89   5681.14    3108.133247
2019-05-05 04:00:00   5681.12   5874.34   5679.88   5829.45    8696.141776
2019-05-05 08:00:00   5829.83   5839.90   5760.00   5813.21    4150.807439
2019-05-05 12:00:00   5814.14   5830.67   5738.02   5755.00    4383.993838
2019-05-05 16:00:00   5754.13   5798.82   5710.63   5767.54    4074.713834
2019-05-05 20:00:00   5768.35   5808.22   5750.00   5770.04    3986.937947
.
.
.
2020-08-04 16:00:00  11291.85  11319.37  11000.00  11117.51   12775.544671
2020-08-04 20:00:00 11117.91 11173.73 11092.68 11139.78 3518.540603 程式:
if __name__ == "__main__":
    klines = GetKline(url, symbol, '1d', ToMs('2019-05-01 12:00:00'))
    print (klines)
輸出:
                         open      high       low     close         volume
date
2019-05-02 08:00:00   5383.20   5538.00   5370.00   5492.87   22795.787835
2019-05-03 08:00:00   5494.81   5844.00   5477.57   5772.69   46297.172849
2019-05-04 08:00:00   5770.62   5900.00   5587.45   5829.45   39682.408991
2019-05-05 08:00:00   5829.83   5839.90   5696.00   5775.62   23822.543775
2019-05-06 08:00:00   5773.18   5805.00   5619.14   5747.79   25256.596325
2019-05-07 08:00:00   5749.92   6028.41   5747.74   5846.34   39905.064422
2019-05-08 08:00:00   5846.34   6014.72   5772.20   5987.29   23074.051520
2019-05-09 08:00:00   5986.66   6224.55   5983.71   6209.18   27453.011436
2019-05-10 08:00:00   6209.95   6468.92   6172.00   6373.33   36623.610790
2019-05-11 08:00:00   6375.16   7343.99   6372.85   7076.22   74022.424393
2019-05-12 08:00:00   7076.24   7521.78   6750.00   6967.31   86948.975339
2019-05-13 08:00:00   6968.24   8100.00   6870.00   7790.71   85804.735333
2019-05-14 08:00:00   7795.62   8366.00   7599.56   7947.56   76583.722603
2019-05-15 08:00:00   7945.26   8249.00   7850.00   8169.87   37884.327211
2019-05-16 08:00:00   8169.08   8320.00   7705.00   7866.59   69630.513996
2019-05-17 08:00:00   7868.67   7925.00   6913.00   7355.26   88752.008159
2019-05-18 08:00:00   7355.28   7458.00   7156.61   7257.45   37054.944779
2019-05-19 08:00:00   7257.32   8275.09   7243.08   8148.48   65577.442058
2019-05-20 08:00:00   8147.94   8156.03   7553.00   7938.15   65859.208564
2019-05-21 08:00:00   7937.16   8042.32   7771.00   7904.87   52301.752247
2019-05-22 08:00:00   7904.48   8016.00   7465.00   7628.43   49136.994589
2019-05-23 08:00:00   7627.80   7940.98   7461.00   7851.51   49648.184701
2019-05-24 08:00:00   7849.95   8130.00   7766.00   7964.87   46664.785325
.
.
.
2020-08-03 08:00:00  11071.36  11473.00  10936.00  11219.81   56931.841475
2020-08-04 08:00:00 11219.68 11414.98 11000.00 11155.67 33502.125826 程式:
if __name__ == "__main__":
    klines = GetKline(url, symbol, '1d', ToMs('2019-05-01 12:00:00'))
    mpf.plot(klines)
輸出:
可以看到,原生圖表有一種眼睛被強暴了的感覺,醜的出奇!我們可以透過 type 參數對它進行調整 ( 默認為 ohlc ):
mpf.plot(klines, type = 'candle') # 蠟燭圖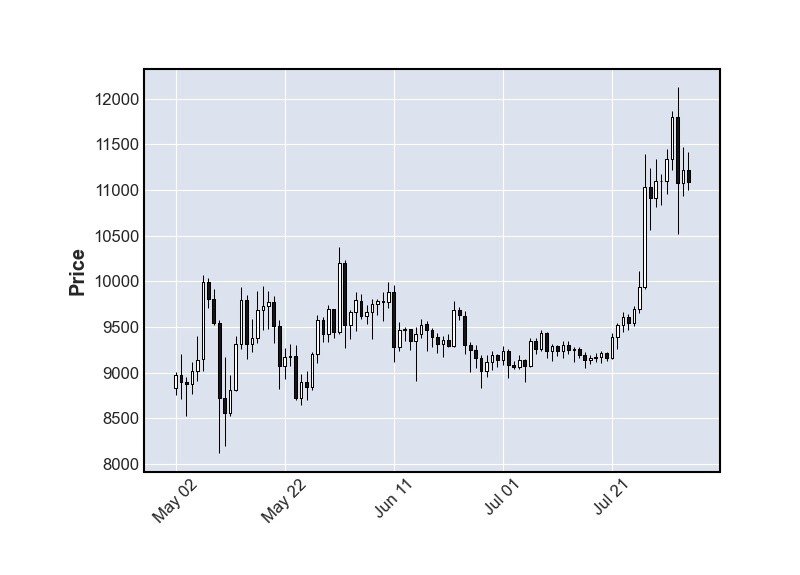
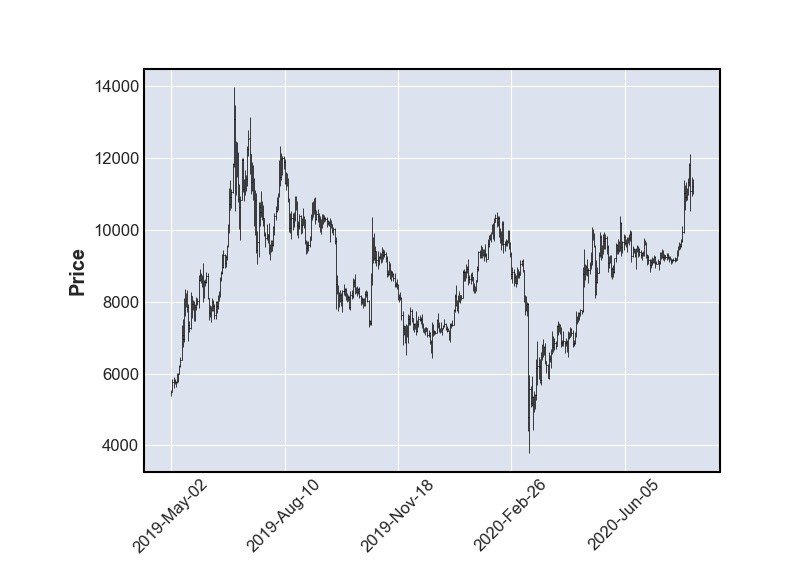
mpf.plot(klines, type = 'line') # 線圖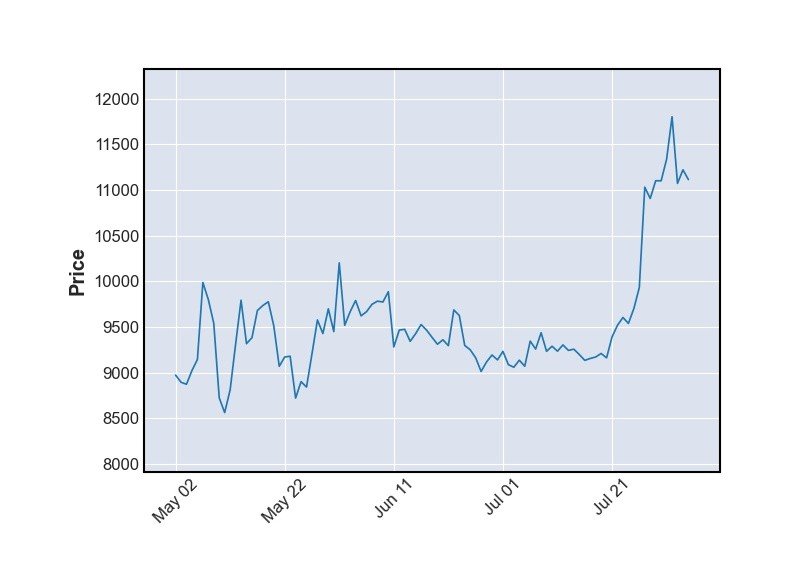
除此之外,還能利用 title 參數為圖表加上標題:
mpf.plot(klines, type = 'line', title = 'Bitcoin Chart')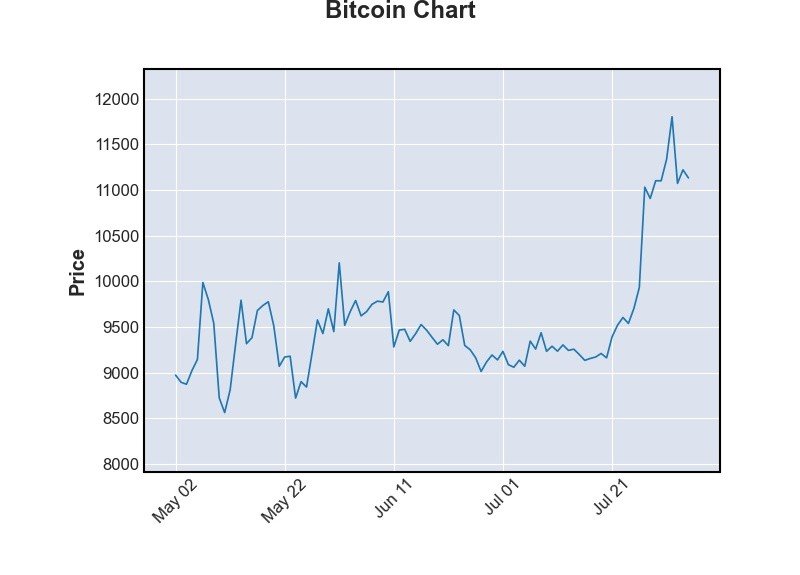
mpf.plot(klines, type = 'line', title = symbol) # 用前面的全域變數命名
不想立即打印圖表的話,也可以透過 block 參數控制:
mpf.plot(klines, type = 'line', title = symbol, block = False)
plt.show() # 手動打印作者 Daniel Goldfarb 提供了非常貼心的參數 ── mav,我們可以通過 mav 這項參數直接在圖表上繪製均線,不須額外計算!
# 單組直接宣告即可
mpf.plot(klines, type = 'line', title = symbol, mav = 10)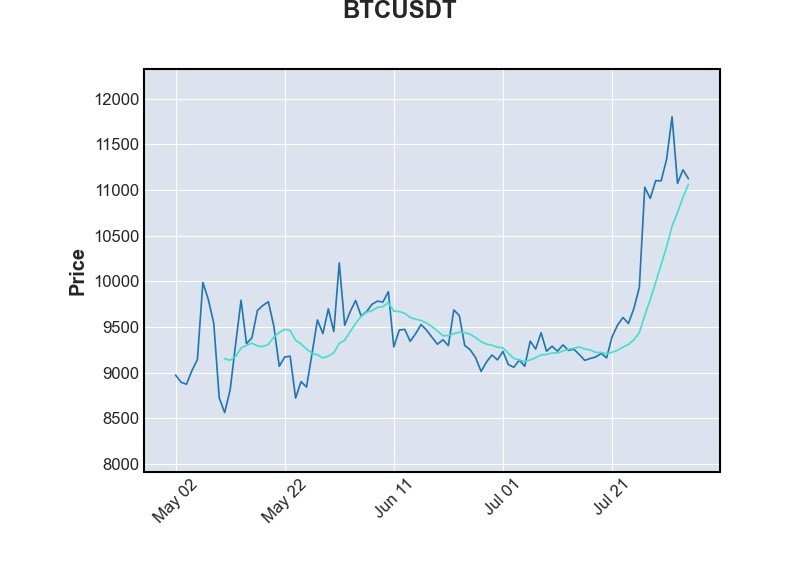
# 多組均線可以利用元組達成
mpf.plot(klines, type = 'line', title = symbol, mav = (5, 10, 20))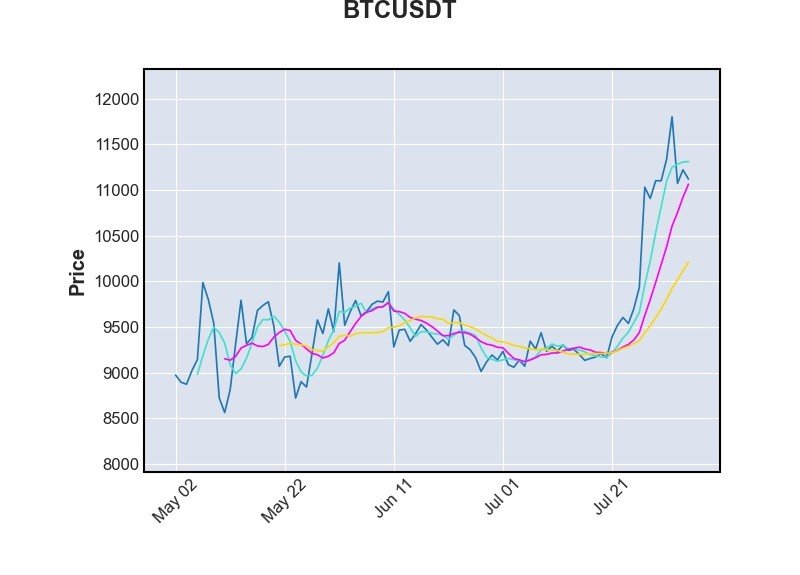
一開始調用的時候我們已經有導入財務指標計算模組 TA-LIB 了,可以利用 TA-LIB將各指標數據計算完成之後,利用 make_addplot 將其繪製到圖表上。
# # Financial indicators

def DEMA(df, period):
    return abstract.DEMA(df, timeperiod=period)

def EMA(df, period):
    return abstract.EMA(df, timeperiod=period)

def SMA(df, period):
    return abstract.SMA(df, timeperiod=period)

def RSI(df, period):
    return abstract.RSI(df, timeperiod=period)
DEMA繪製
    index  = mpf.make_addplot(DEMA(klines, 10))
    mpf.plot(klines, type = 'line', title = symbol, addplot = [index])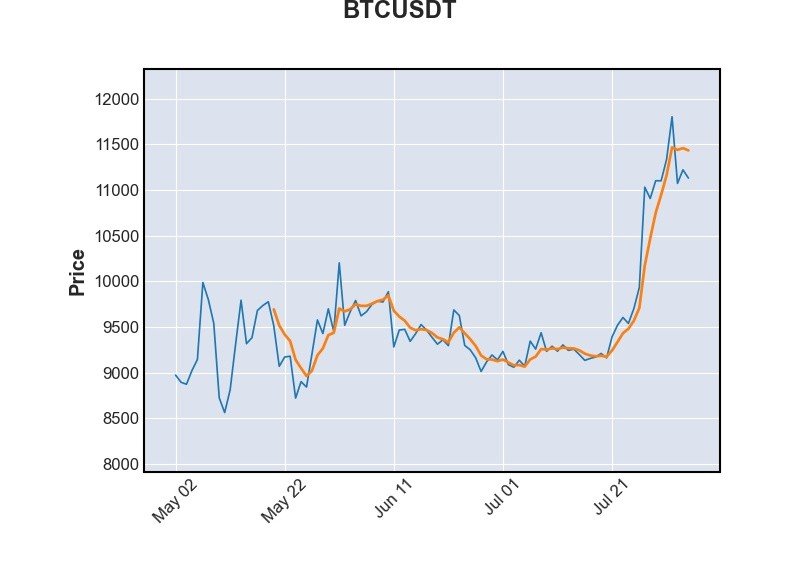
EMA繪製 ( 可以透過 panel 指定繪製區域 )
    index  = mpf.make_addplot(EMA(klines, 20), panel = 1)
    mpf.plot(klines, type = 'line', title = symbol, addplot = [index])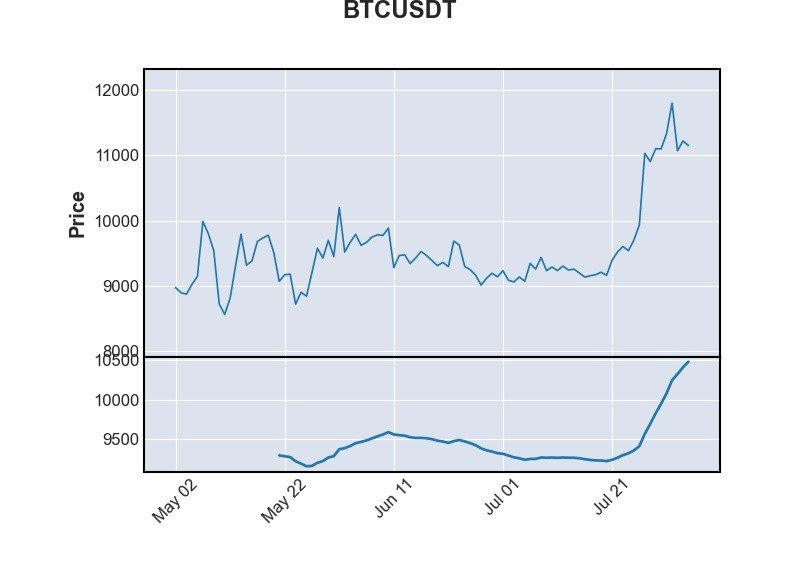
SMA繪製 ( 可以透過 ylabel 替指標命名 )
    index  = mpf.make_addplot(SMA(klines, 20), panel = 1, ylabel = 'SMA 20')
    mpf.plot(klines, type = 'line', title = symbol, addplot = [index])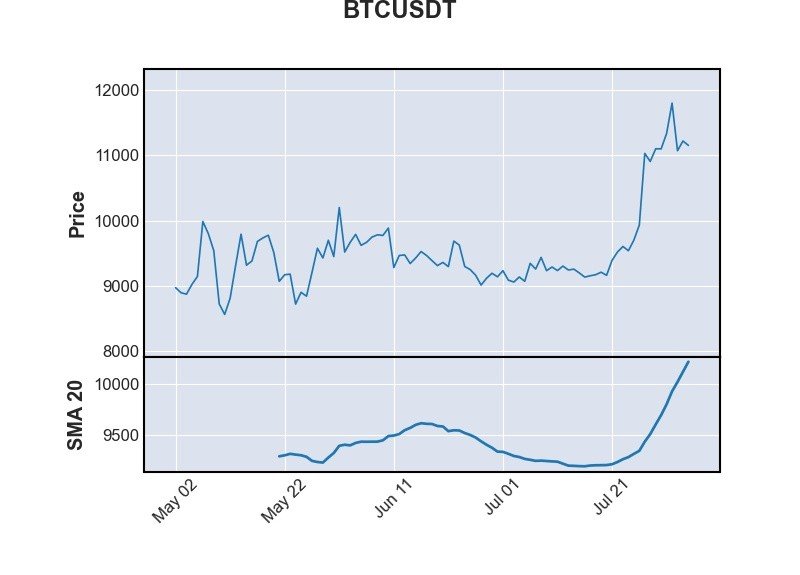
RSI繪製 ( 可以透過 color 指定指標繪製時的顏色 )
    index  = mpf.make_addplot(RSI(klines, 14), panel = 1, ylabel = 'RSI', color = 'lime')
    mpf.plot(klines, type = 'line', title = symbol, addplot = [index])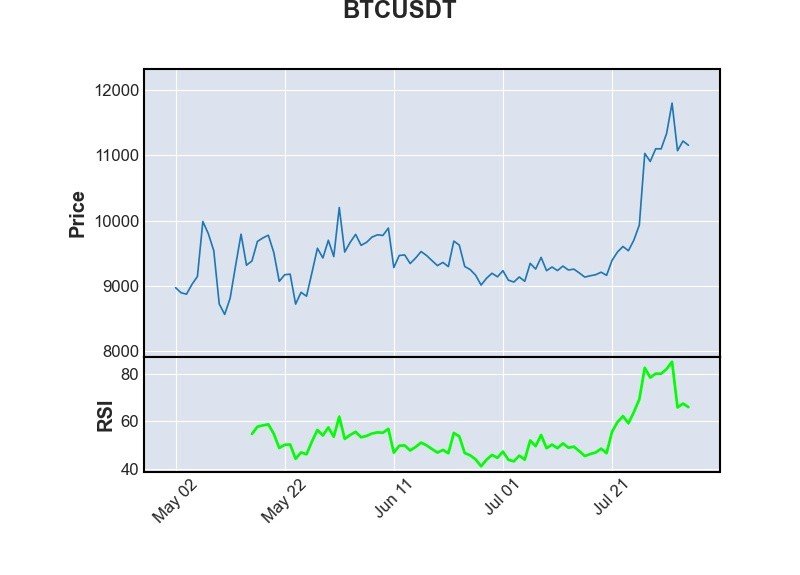
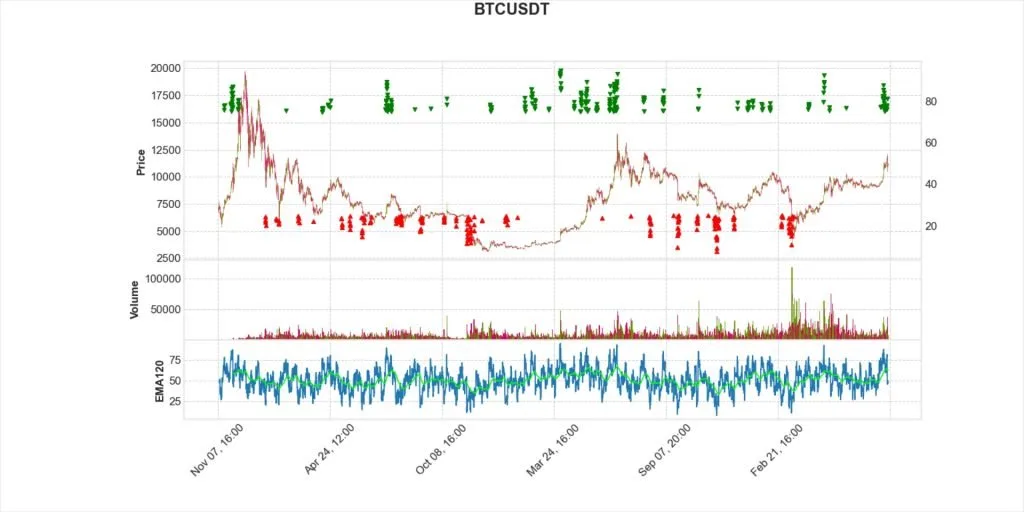
一個好的交易圖表成交量是肯定是不能缺席的!作者將成交量打包成了 volume 參數供使用者調用。
    index  = mpf.make_addplot(RSI(klines, 14), panel = 2, ylabel = 'RSI')
    mpf.plot(klines, type = 'line', title = symbol, addplot = [index], volume = True)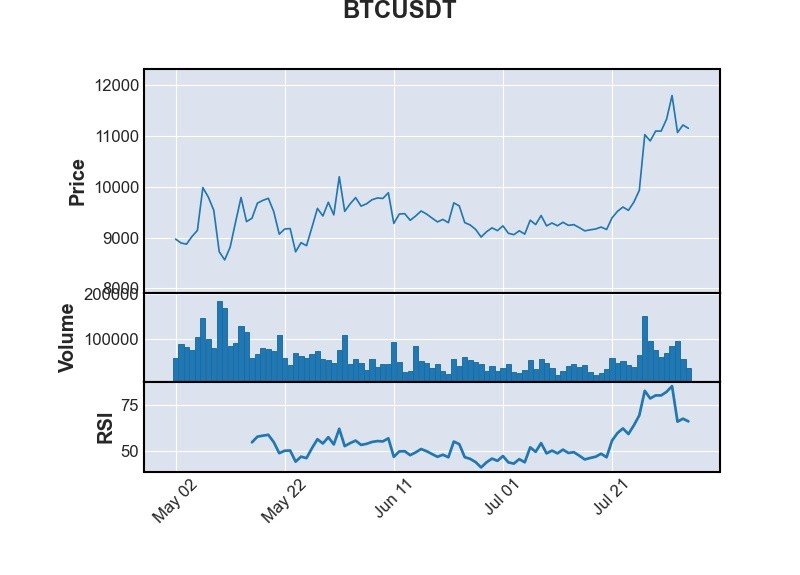
mplfinance 提供了一些常見的交易圖表風格可以直接調用,不需要從頭開始學習如何設計圖表,對新手非常友善!
    # 可以利用打印輸出所有內建圖表風格

    print (mpf.available_styles())
['binance', 'blueskies', 'brasil', 'charles', 'checkers', 'classic', 'default', 'mike', 'nightclouds', 'sas', 'starsandstripes', 'yahoo']透過 style 即可調用內建風格,筆者這邊提供幾個範例:
mpf.plot(klines, type = 'candle', style = 'binance', title = symbol, addplot = [index], volume = True)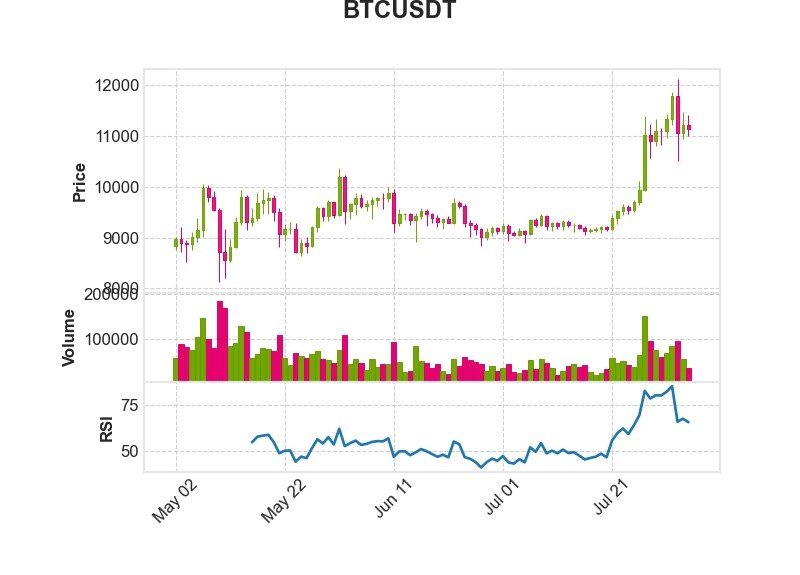
mpf.plot(klines, type = 'candle', style = 'blueskies', title = symbol, addplot = [index], volume = True)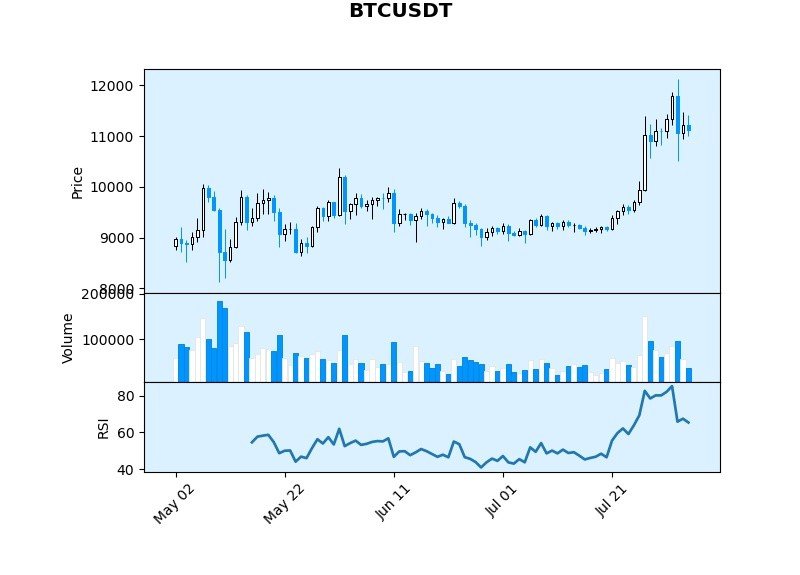
mpf.plot(klines, type = 'candle', style = 'charles', title = symbol, addplot = [index], volume = True)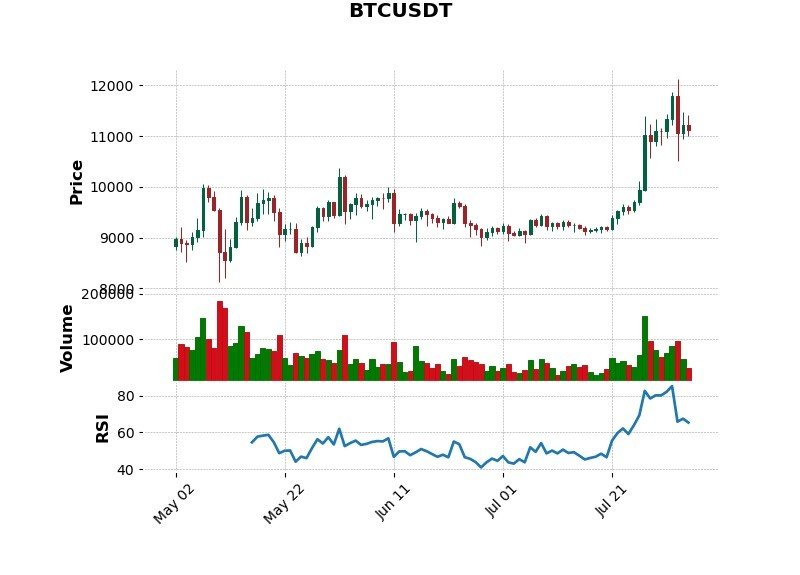
由於虛擬貨幣交易市場並不像傳統金融有所謂的「停盤時間」,因此刪除非交易日空白對我們來說並不重要,不過考慮到可能有人會想要應用到股票市場或是研究所需,筆者在這邊一樣附上程式碼給大家。
    # show_nontrading 參數內建為 False
mpf.plot(klines, type = 'candle', style = 'charles', title = symbol, addplot = [index], volume = True, show_nontrading = True)mplfinance 模組提供非常簡易的參數調用方式以及圖表繪製功能,相信各位讀者閱讀到這裡已經可以繪製一套功能齊全的圖表,而風格設計方式、交易信號標示等細節,有機會的話筆者有空會再寫一篇,當然有興趣的小夥伴也先可以查詢 mplfinance 的官方文檔自行研究。
👉 延伸閱讀:虛擬貨幣新手入門指南:從開戶到投資完整教學